

In the finance world, ‘open interest‘ as defined by Investopedia is, “the total number of outstanding derivative contracts, such as options or futures.” And for those of you not familiar with the term, an option is a contract that gives the owner the right to either buy (call option) or sell (put option) a stock at a given price (strike price) on a specific date (the expiration date).
In the AI field, there is not only a thirst for learning better and better AI models but also a need to understand the data on which the AI models run. Good AI models don’t just give us the answer that we seek, but help us understand the data as a whole thus empowering us (as humans) to do even better at the task at hand. As an AI researcher you are continually looking for data anomalies that may give you a slightly better signal when trained under the right AI model.
While working with option open interest data we ran across one such anomaly in the near-term open interest data of the GLD (gold), SLV (silver) and UUP (US Dollar) ETF’s.
Before discussing this odd relationship, let’s discuss what led us to it. To get a better view on the markets price direction ‘bias’ for a given instrument, we create a graph showing the difference between call and put option open interest per expiration which are then tabulated and displayed per strike along the x-axis in a histogram format. Positive histogram bars represent strikes with more call option open interest than put option open interest, and negative histogram bars represent strikes with the opposite relationship. Given that the differences are taken per expiration data (for which there are many per strike), each strike may show both positive and negative bars where a balanced (or no) bias would show the same length positive and negative bar on the same strike.
In a simple sense, this graph provides a visual representation of the put/call ratio for the instrument. This graphical analysis can quickly tell you whether the market is more biased toward call options (e.g. more call open interest than put) or put options (e.g. more put open interest than call). And in our limited view (and this is in no means intended as investment advice), we would interpret a high bias toward calls to mean the market expects the price to rise and a high bias towards puts to mean the market expects the price to fall.
While visualizing the open interest on the UUP (US Dollar) ETF, we found a strong skew toward call options with very little put option open interest. To us this seemed somewhat intuitive, for there is currently a very large global dollar shortage [1][2][3] which seems to be persisting even after the massive stimulus moves by the FED [4][5].
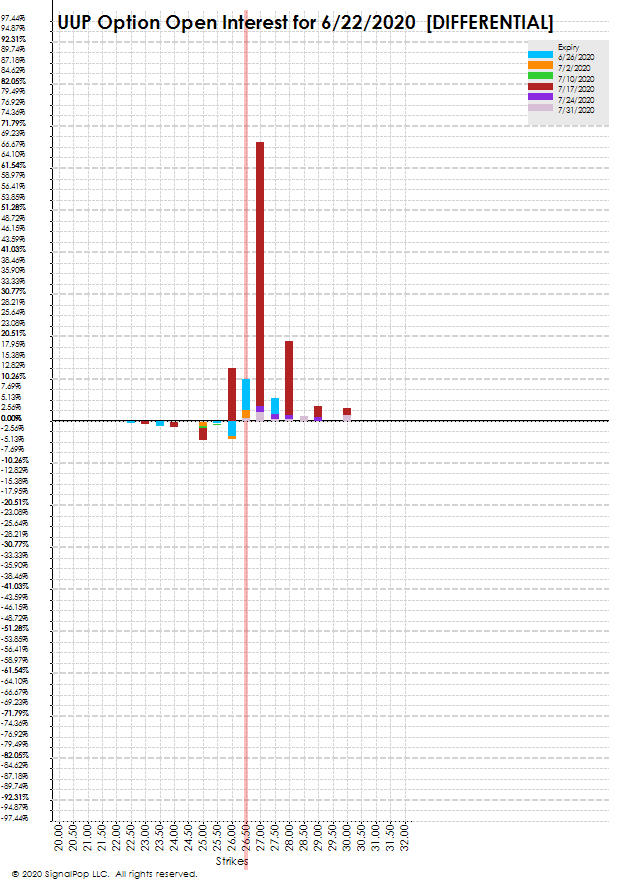
As shown above, there is a strong bias towards the call options for UUP with most of the call option open interest showing up in the 7/17/2020 expiration. We interpret this to mean the market is anticipating the value of UUP (and the US Dollar) to rise in value.
According to macroaxis, both GLD and SLV each have a negative correlation to UUP.
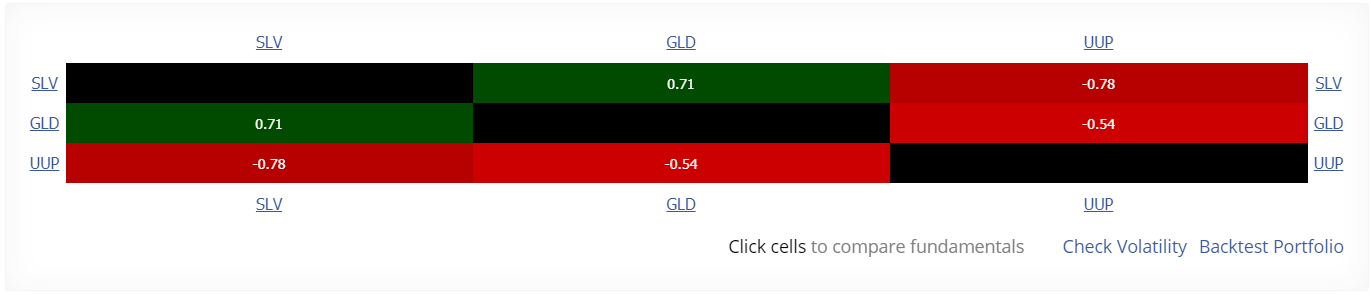
GLD has a –0.54 negative correlation to UUP and
SLV has a -0.78 negative correlation to UUP.
Intuitively, with these negative correlations, we would expect to also see a bias towards the puts in both GLD and SLV. However, surprisingly, that is not so.
Both the GLD ETF…
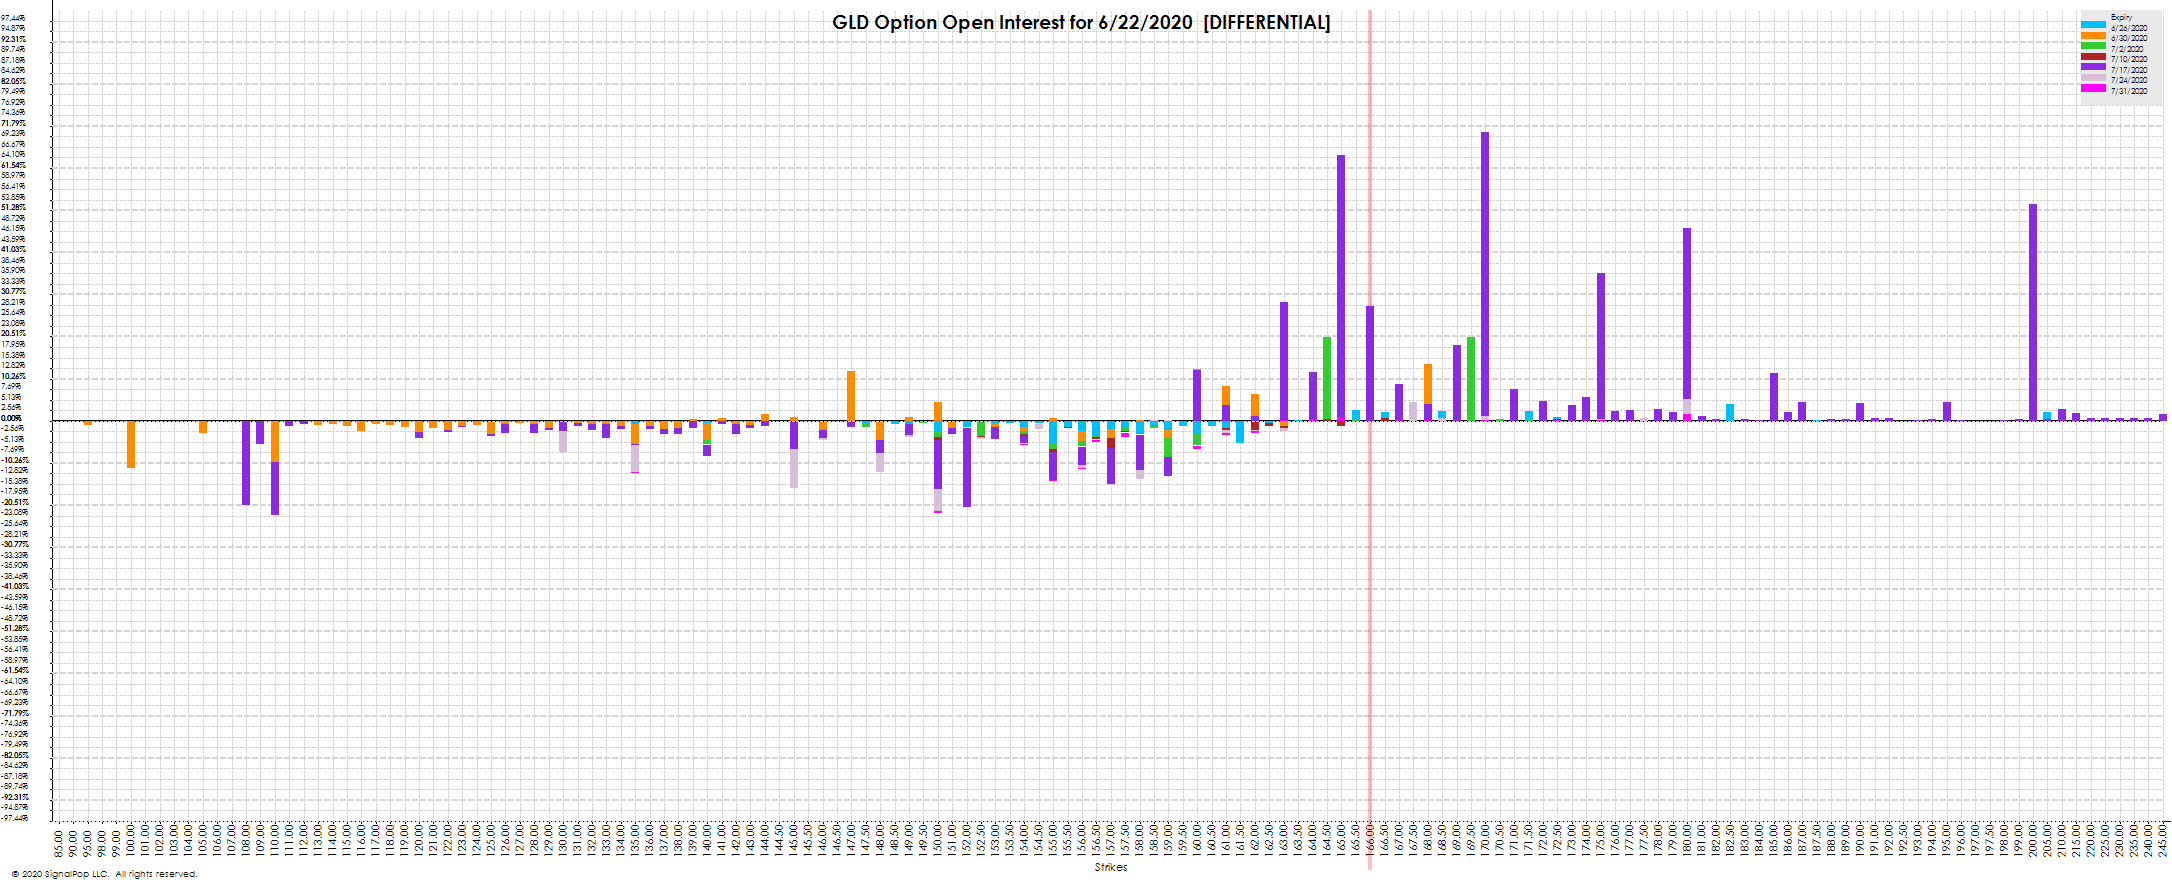
…and the SLV ETF…
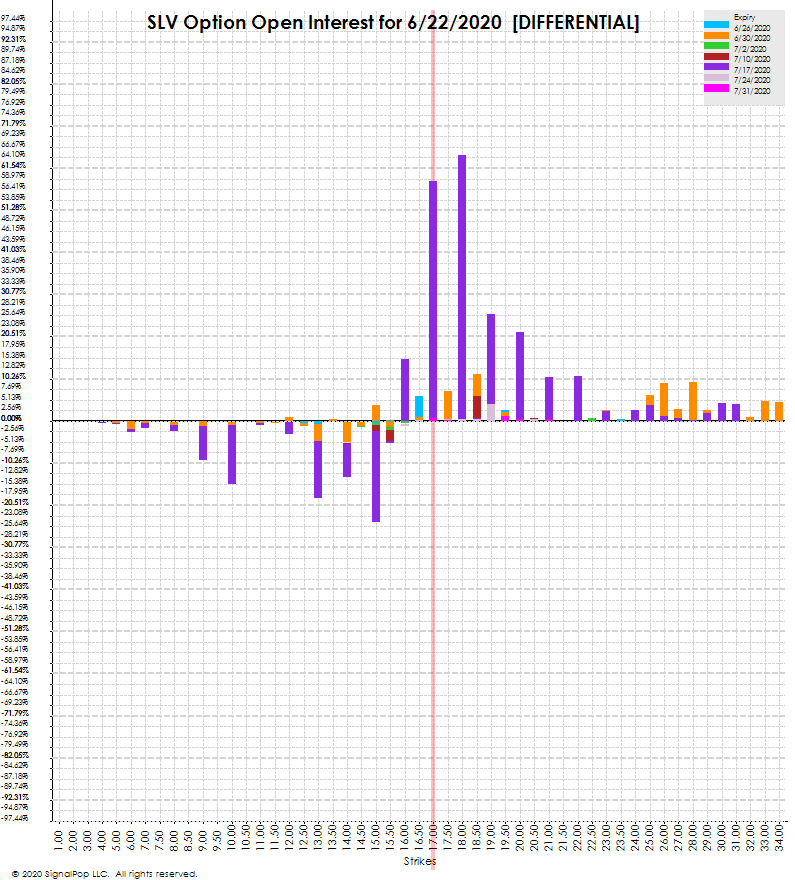
…have VERY strong biases toward the call options with far more call open interest than put open interest observed on both GLD and SLV!
This is not only counter intuitive, but goes against the negative correlations observed. These are indeed strange and extreme times. Is the market wrong?
Or, given the extreme environment, are countries who do not have access to the US currency swap lines using the the smaller metals markets as a hedge which ends up driving up both GLD/SLV and UUP at the same time?
Well, we really don’t know, but if you would like to use AI modeling and analytics to get a better understanding of what actually is happing, let us know for we would like to work with you!
For serious inquiries just send us a note on our Contact Us page.
Full Disclosure, from time to time we may hold open positions in GLD, SLV and/or hold USD. As always, use at your own risk and do your own diligence.
[1] B. W. Setser (Mar 17, 2020). Addressing the Global Dollar Shortage: More Swap Lines? A New Fed Repo Facility for Central Banks? More IMF Lending?. Council on Foreign Relations
[2] C. Anstey and E. Curran (Mar 22, 2020). Dire Dollar Shortage Shows Failure to Fix Key Crisis Flaw. Bloomberg
[3] M. Every (Apr 12, 2020). ‘Down The Rabbit Hole’ – The Eurodollar Market Is The Matrix Behind It All. ZeroHedge
[4] D. Lacalle (Mar 31, 2020). Why the World Has a Dollar Shortage, Despite Massive Fed Action. Mises Institute
[5] D. Lacalle (May 3, 2020). Global US Dollar Shortage Rises as Emerging Markets Lose Reserves. DanielLacalle Site