

The US Securities and Exchange Commission’s EDGAR database contains the public filings of public US companies, including quarterly (10Q) and annual (10K) filings as well as 13F filings that list the positions held by investment-based companies at the time of each filing.
Using the MyCaffe AI Platform to analyze each of these filings, we were able to predict when a fund increased their positions with a 70% accuracy.
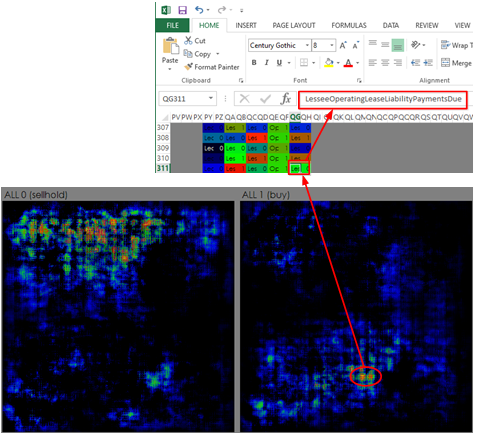
Reversing these models revealed which data items within each filing had higher correlations with the decisions made by fund.
For example, the circled hot spot shown in the ALL 1 (buy) image (right side above) represents Lease information that we presume relates to lease information from Oil and Gas company 10Q/10K filings. As shown above, the corresponding item selected on the Excel spreadsheet relates to LesseeOperatingLeaseLiabilityPaymentDue which according to the EDGAR database is defined as:
LesseeOperatingLeaseLiabilityPaymentDue – Amount of lessee’s undiscounted obligation for lease payment for operating lease.
Each Excel spreadsheet contains thousands of similar items that show how strongly each data value contributes to the firing of a given label.
The above image hot-spot mappings were created showing how buy vs sell/hold decisions were made for all equities. However, such mappings can be created to focus on a company, sector, or industry, which may provide meaningful insights on how the objective data relates to investment decisions made.
The following hot-spot map shows the data points that triggered the sell/hold label (learned using nearly 40,000 position changes over 10 years).
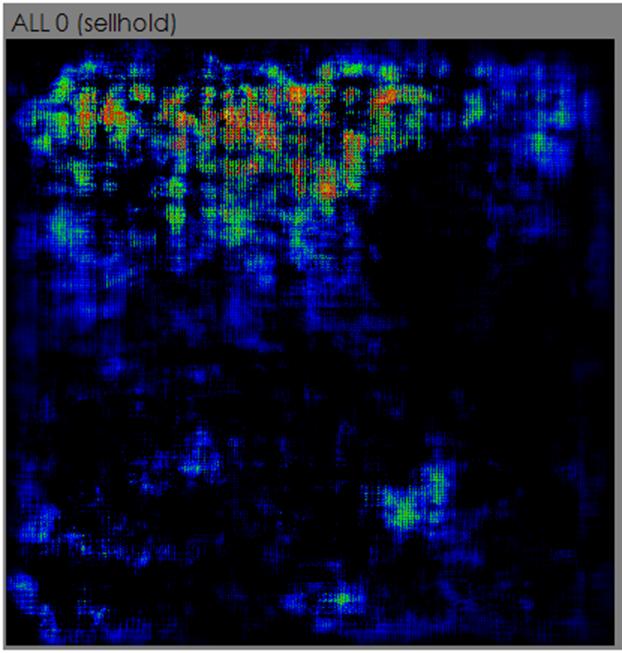
Several notable hot-spot items impacting the decision to sell/hold a position are:
PaymentsToAcquireLoansReceivable
LineOfCreditFacilityInterestRateDuringPeriod
IncreaseDecreaseInDerivativeLiabilities
CapitalizedCostsOfUnprovedPropertiesExcludedFromAmortization
DebtSecuritiesAvailableForSaleRealizedGainLoss
The following hot-spot map shows the data points that triggered the buy label (learned using nearly 40,000 position changes over 10 years).
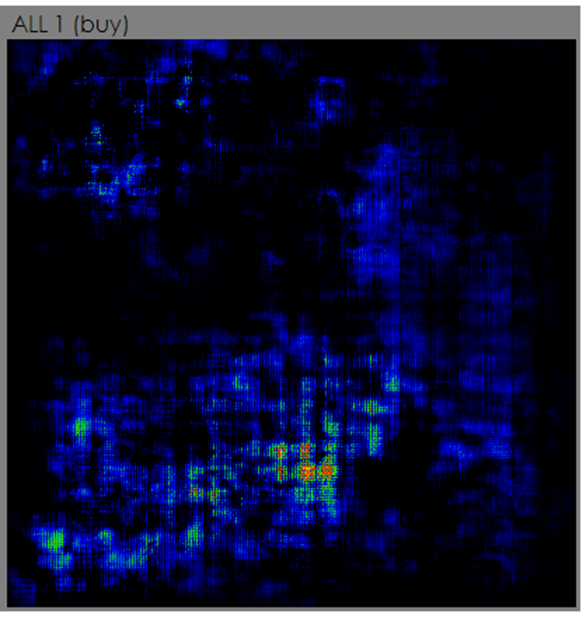
Several notable hot-spot items impacting the decision to increase a position are:
IncreaseDecreaseInRiskManagementAssetsAndLiabilities
WeightedAverageNumberOfSharesContingentlyIssuable
NumberOfRestaurants
SharebasedCompensationArrangementBySharebasedPaymentAwardOptionsNonvestedNumberOfShares
LesseeOperatingLeaseLiabilityPaymentsDueYearFour
If you would like to learn more about analyzing the EDGAR database with AI, see the AI Analysis of EDGAR report.